Building a Sentinel detection lab · Part 1
Building a Sentinel Detection Lab, Part 1: Catching Brute Force (and the Bug That Flagged the Wrong Account)
Writing my first detection, and the parsing bug that taught me more than the detection itself.
Part 1 of a series on building a detection engineering lab in Microsoft Sentinel from scratch. This post: writing my first detection, and the parsing bug that taught me more than the detection itself.
Repo: github.com/Kajal-Dhanjal/sentinel-detection-lab
I'm building a detection engineering lab in Microsoft Sentinel — a Windows VM shipping security and Sysmon logs into a Log Analytics workspace, where I write KQL detections against simulated attacks. This is the first detection I wrote, and the first one that taught me why detection engineering is harder than it looks. The goal was simple on paper: detect a brute-force login attack. Someone hammering a machine with wrong passwords should trigger an alert. What I learned is that "simple on paper" hides three problems that only show up when you actually build it.
The setup
My VM forwards Windows Security events into a Log Analytics table. A failed login writes Event ID 4625 — the single most important number in this detection. So my first query was the obvious one:
Event
| where EventLog == "Security"
| where EventID == 4625
| where TimeGenerated > ago(2h)
To generate test data, I ran failed logins by hand on the VM:
runas /user:fakeuser cmd #wrong password
runas /user:hacker cmd #wrong password
Wrong password each time. Each attempt wrote a 4625. The query returned them. So far, so good—I had failed-login events flowing in. But a list of failed logins isn't a detection. It's a search. And the moment I tried to turn it into something that names who was attacked, the first problem appeared.
Problem 1: there's no clean username column
I expected a tidy TargetUsername column. There wasn't one. In my table, the entire human-readable event sits inside a single field, RenderedDescription, as one long text blob:
An account failed to log on. Subject: … Account For Which Logon Failed: … Account Name: …
To detect on the username, I couldn't just reference a column — I had to extract it from text. That meant regex. KQL has extract() for exactly this:
| extend TargetAccount = extract(@"Account Name:\s+(\S+)", 1, RenderedDescription)This says: search the text for "Account Name:" followed by whitespace, then capture the next chunk of non-space characters. The 1 means "give me the first captured group." I ran it, looked at the TargetAccount column, and it said:
labadmin
Which is my own admin account. Not the attacker. That's problem two.
Problem 2: the regex caught the wrong account
It turns out a 4625 event contains two "Account Name:" lines:
-
The Subject — the account that ran the process triggering the login attempt. That was labadmin (me, in my admin shell, running runas).
-
Account For Which Logon Failed — the account that was actually attacked. That was fakeuser.
My regex grabbed the first match it found — the Subject — so my detection was reporting the legitimate user instead of the attacker. In a real SOC, this is not a cosmetic bug. A brute-force rule that names the victim's own admin account instead of the attacker sends responders chasing the wrong lead. The fix was to anchor the regex on the right section first, then jump to the next "Account Name:":
| extend TargetAccount = extract(@"Account For Which Logon Failed:[\s\S]*?Account Name:\s+(\S+)", 1, RenderedDescription)The [\s\S]*? lazily skips everything (including newlines) between "Account For Which Logon Failed:" and the next "Account Name:". Now TargetAccount returned fakeuser. The detection was finally looking at the attacker.
Lesson: when you parse log text, don't trust the first match. Know the structure of the event, and anchor on the part you actually want.
Turning a search into a detection
Extracting the username gives you data. A detection needs a threshold — the logic that says "this pattern is suspicious." For brute force, that's volume: many failures in a short window.
Event
| where EventLog == "Security"
| where EventID == 4625
| extend TargetAccount = extract(@"Account For Which Logon Failed:[\s\S]*?Account Name:\s+(\S+)", 1, RenderedDescription)
| where isnotempty(TargetAccount) and TargetAccount != "-"
| summarize FailedAttempts = count(), TargetedAccounts = make_set(TargetAccount) by Computer, bin(TimeGenerated, 5m)
| where FailedAttempts >= 5
The two lines that matter:
summarize ... by Computer, bin(TimeGenerated, 5m)counts failures per machine in 5-minute buckets.
where FailedAttempts >= 5is the threshold. Below it, normal. Above it, flag it.
That threshold line is the difference between a log search and a detection. And it created problem three.
Problem 3: the detection didn't fire — and that was correct
I ran it. No results. My first instinct was that the query was broken. It wasn't. The issue was my test data. I had run runas only a couple of times, minutes apart, while reading documentation between attempts. So my failures were scattered across different 5-minute buckets — no single bucket ever reached 5.
This is the central tension in detection tuning:
-
Too tight a window misses slow, low-and-slow attacks.
-
Too loose a window floods you with false positives from people fat-fingering their passwords.
A real brute-force bot makes dozens of attempts per minute, so a "5 in 5 minutes" threshold catches it instantly. My manual testing was slow and sparse, so it slipped through — not because the rule was wrong, but because my test didn't resemble a real attack's tempo. That distinction matters. The right move wasn't to lower the threshold to 1 (which would flag every typo in production). It was to recognize the rule was tuned correctly for real attacks, and that my test data simply needed to be a faster burst to validate it.
Add-Type -AssemblyName System.DirectoryServices.AccountManagement
$ctx = New-Object System.DirectoryServices.AccountManagement.PrincipalContext('Machine')
1..8 | ForEach-Object { $ctx.ValidateCredentials("attacker$_","WrongPass123!") | Out-Null }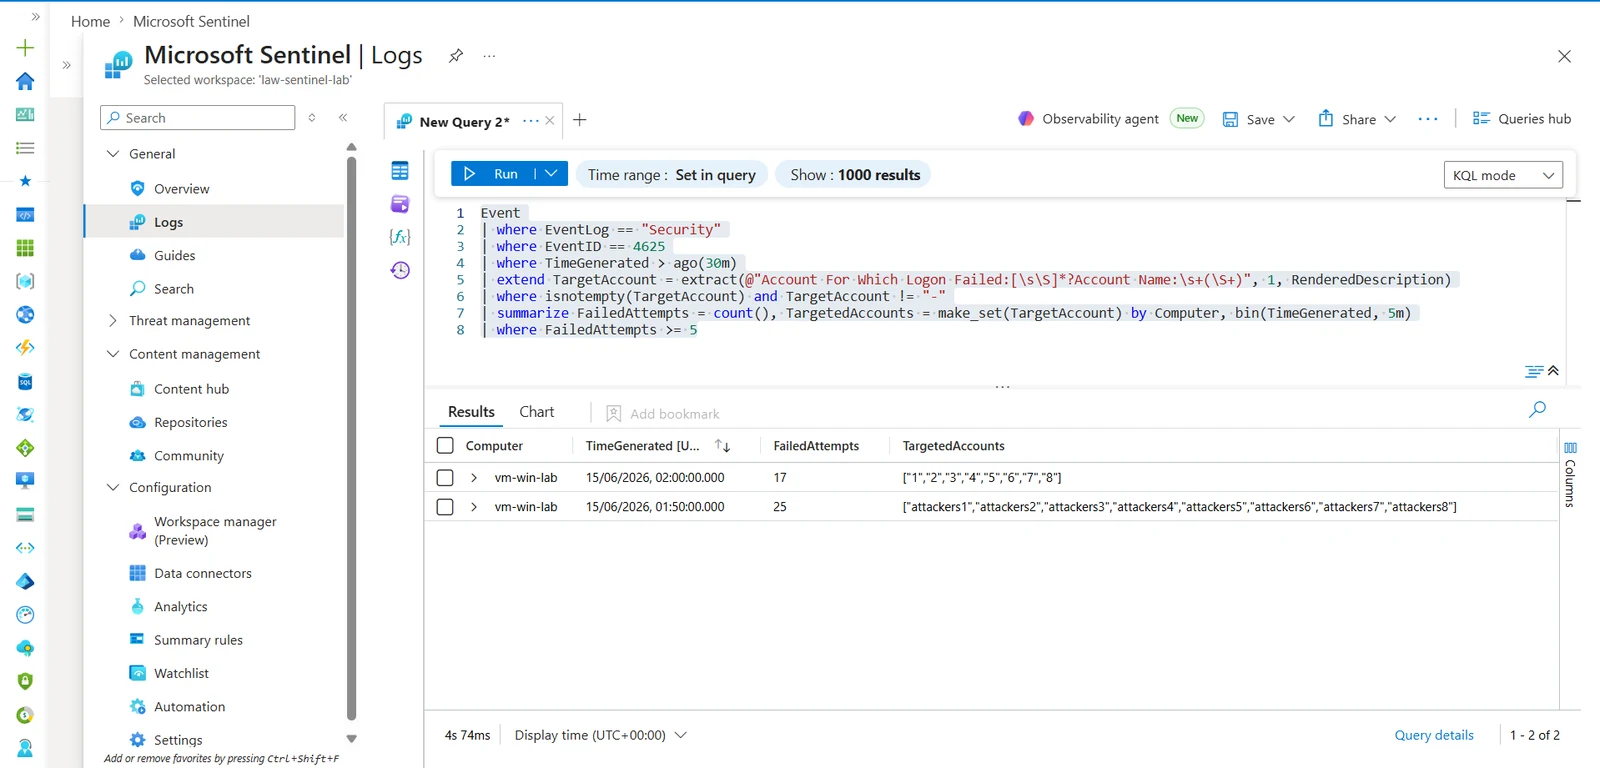
Shipping it
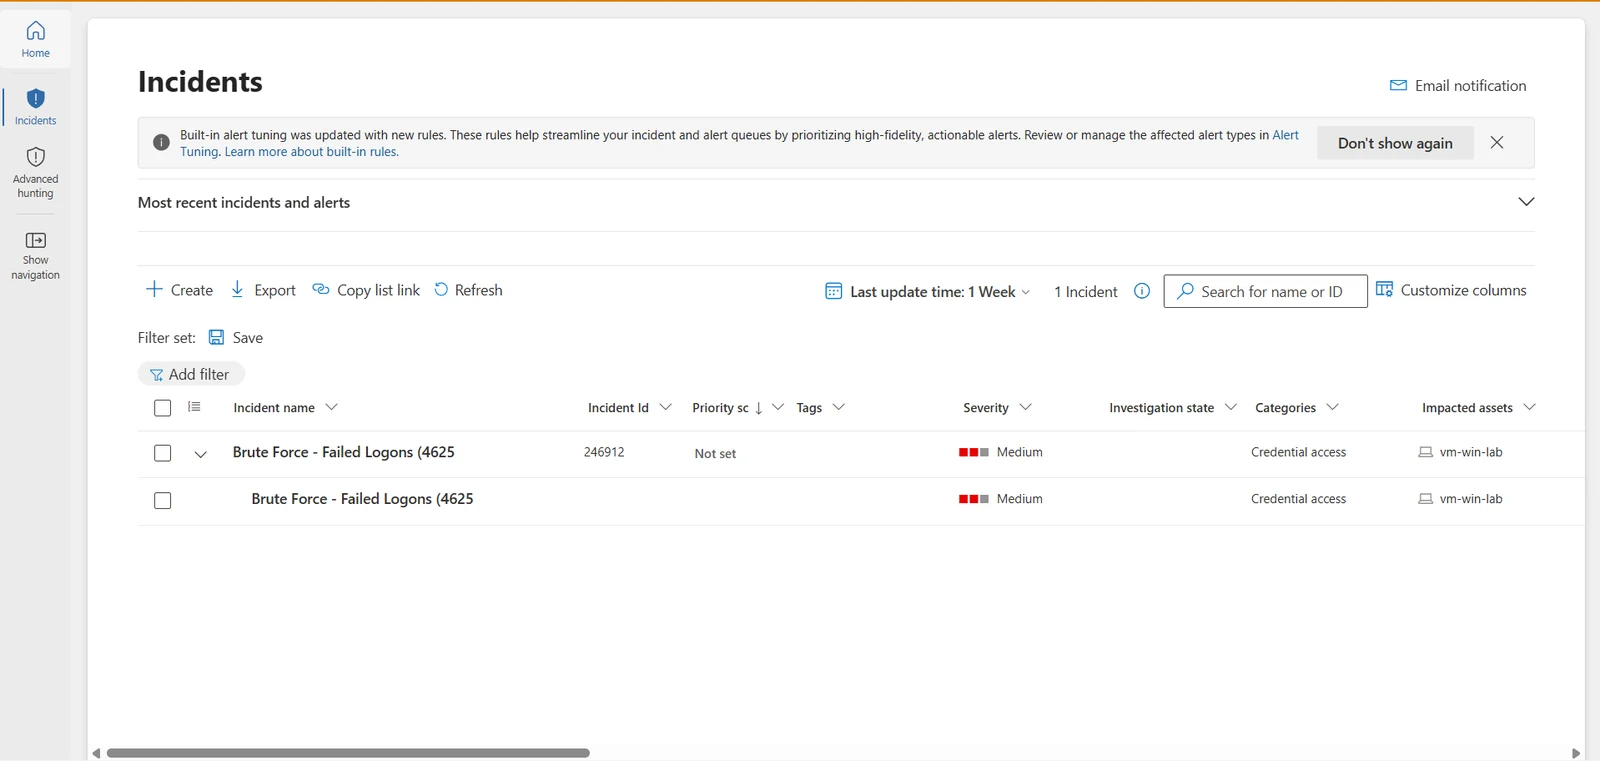
I saved the query as a scheduled analytics rule: runs every 5 minutes, mapped to MITRE T1110 (Brute Force), severity Medium, with the host mapped as an entity so any alert builds an investigation graph. It's now a live detection — not a query I ran once, but a rule watching for brute force on its own.
What I'd do in v2
One refinement I left for later: right now the rule groups by host and collects targeted accounts into a set. A more precise version groups by individual account — flagging "5+ failures against one specific user" rather than "5+ failures total on the box." That's a better detection (password-spray vs. single-account brute force look different), and it makes the account cleanly mappable as an entity. That's the next iteration.
Takeaways
If you're starting detection engineering, the three things this rule taught me:
-
Log data is messier than the column names suggest. Be ready to parse text, and know the structure of your events before you write regex.
-
The first regex match is often the wrong one. Anchor on the section you actually want.
-
A detection not firing isn't always a bug. Sometimes your test data just doesn't look like a real attack — and understanding why is half the skill.
Next up in the lab: a Sysmon-based detection for suspicious PowerShell. More on that soon.
Full lab and detections on GitHub.
This is part of a series on building a detection engineering lab in Microsoft Sentinel from scratch.
Suspicious PowerShell, and Why Some Detections Need No Threshold
Spotted an error or have a suggestion?
Email me
Kajal Dhanjal
I build detections in my own Microsoft Sentinel lab and write up what holds and what doesn’t. About